Lead Capture Dashboard
- Lead Capture Dashboard
- Go to app.getsignals.ai
- 1. Click "Lead Capture"
- 2. Select between "Chatbots Only" and "Forms Only"
- 3. Select date range
- 4. Filter by Traffic Source
- 5. Filter by Traffic Source
- 6. Export your CSV
- 7. Visitor Funnel
- 8. Key Metrics
- 9. Conversations Timeline
- 10. Conversation Tags"
- 11. Conversations by Time of Day
- 12. Conversations by Geo-Location
Lead Capture Dashboard
The lead capture dashboard features six preset reporting widgets, filter options, and a CSV export option.
Go to app.getsignals.ai
1. Click "Lead Capture"

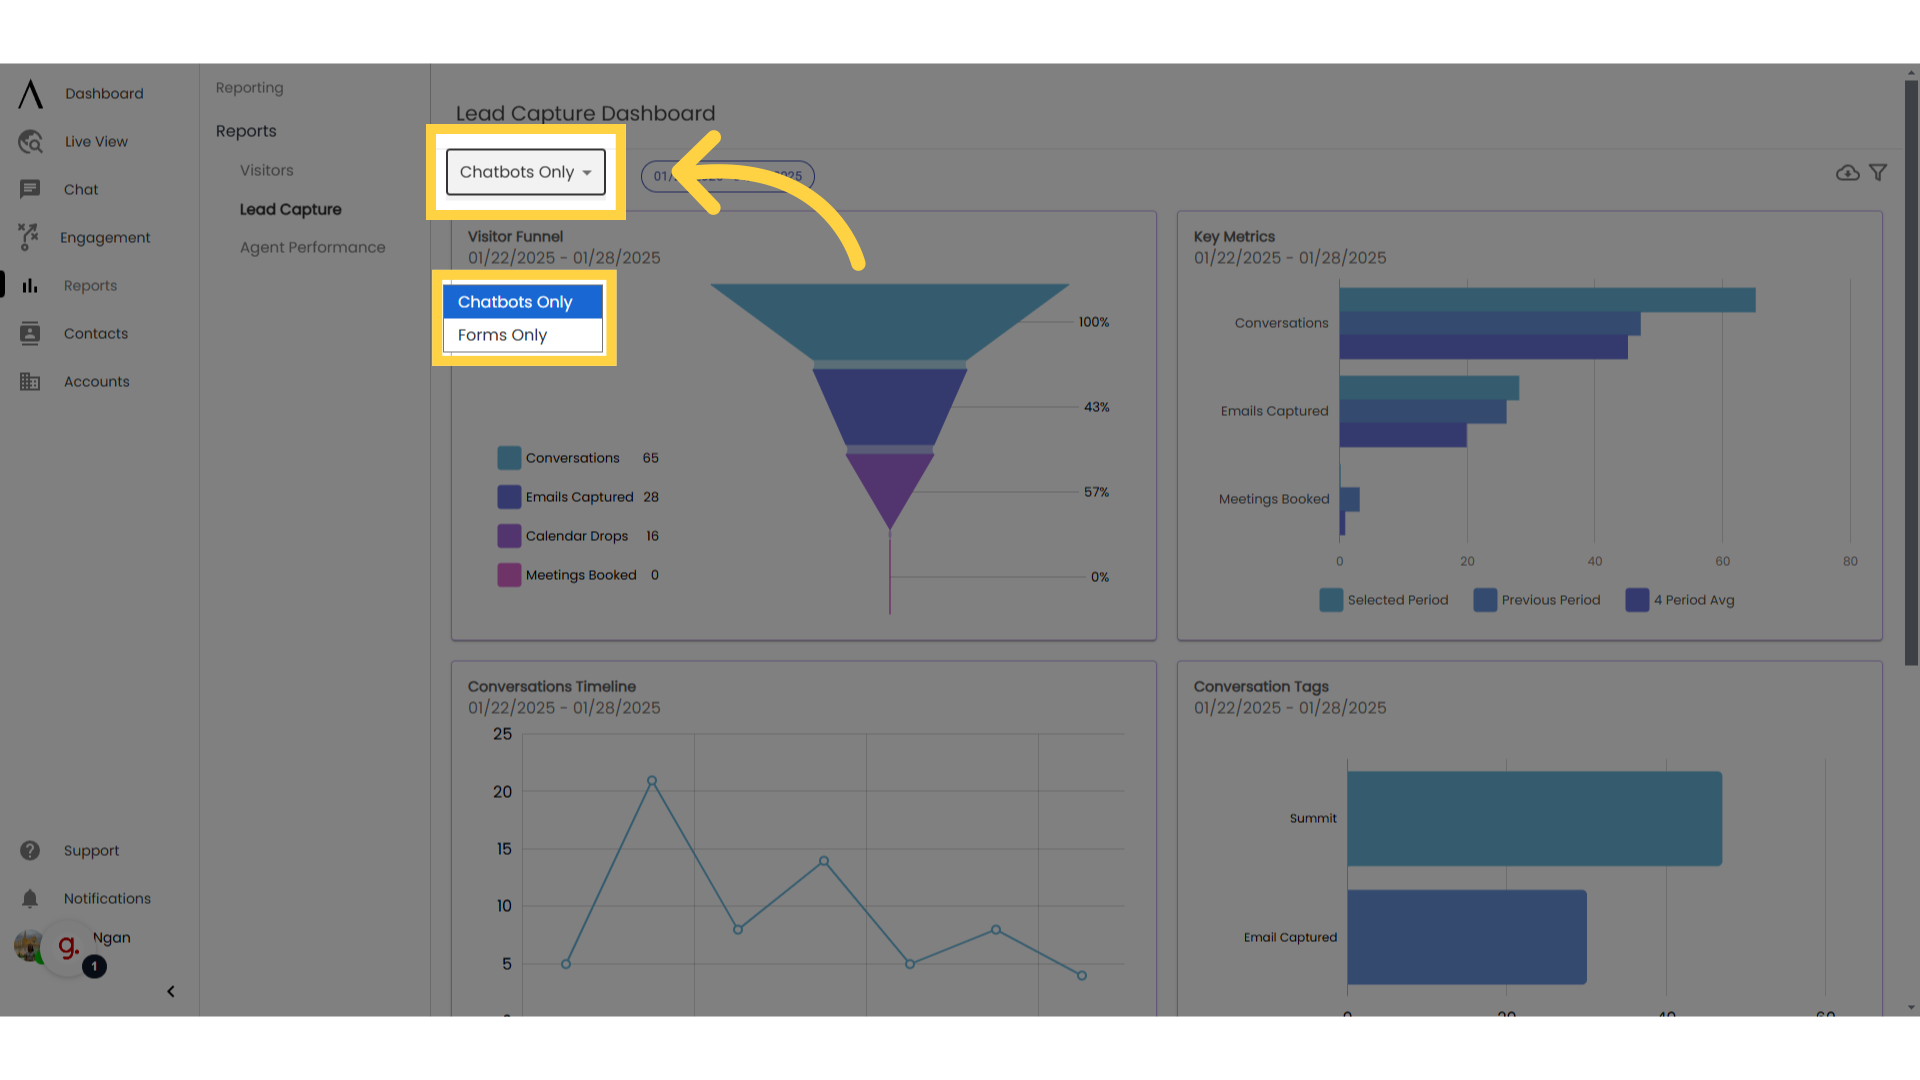
2. Select between "Chatbots Only" and "Forms Only"
The lead capture dashboard is split up between "Chatbots Only" and "Forms Only." Pick one to view.
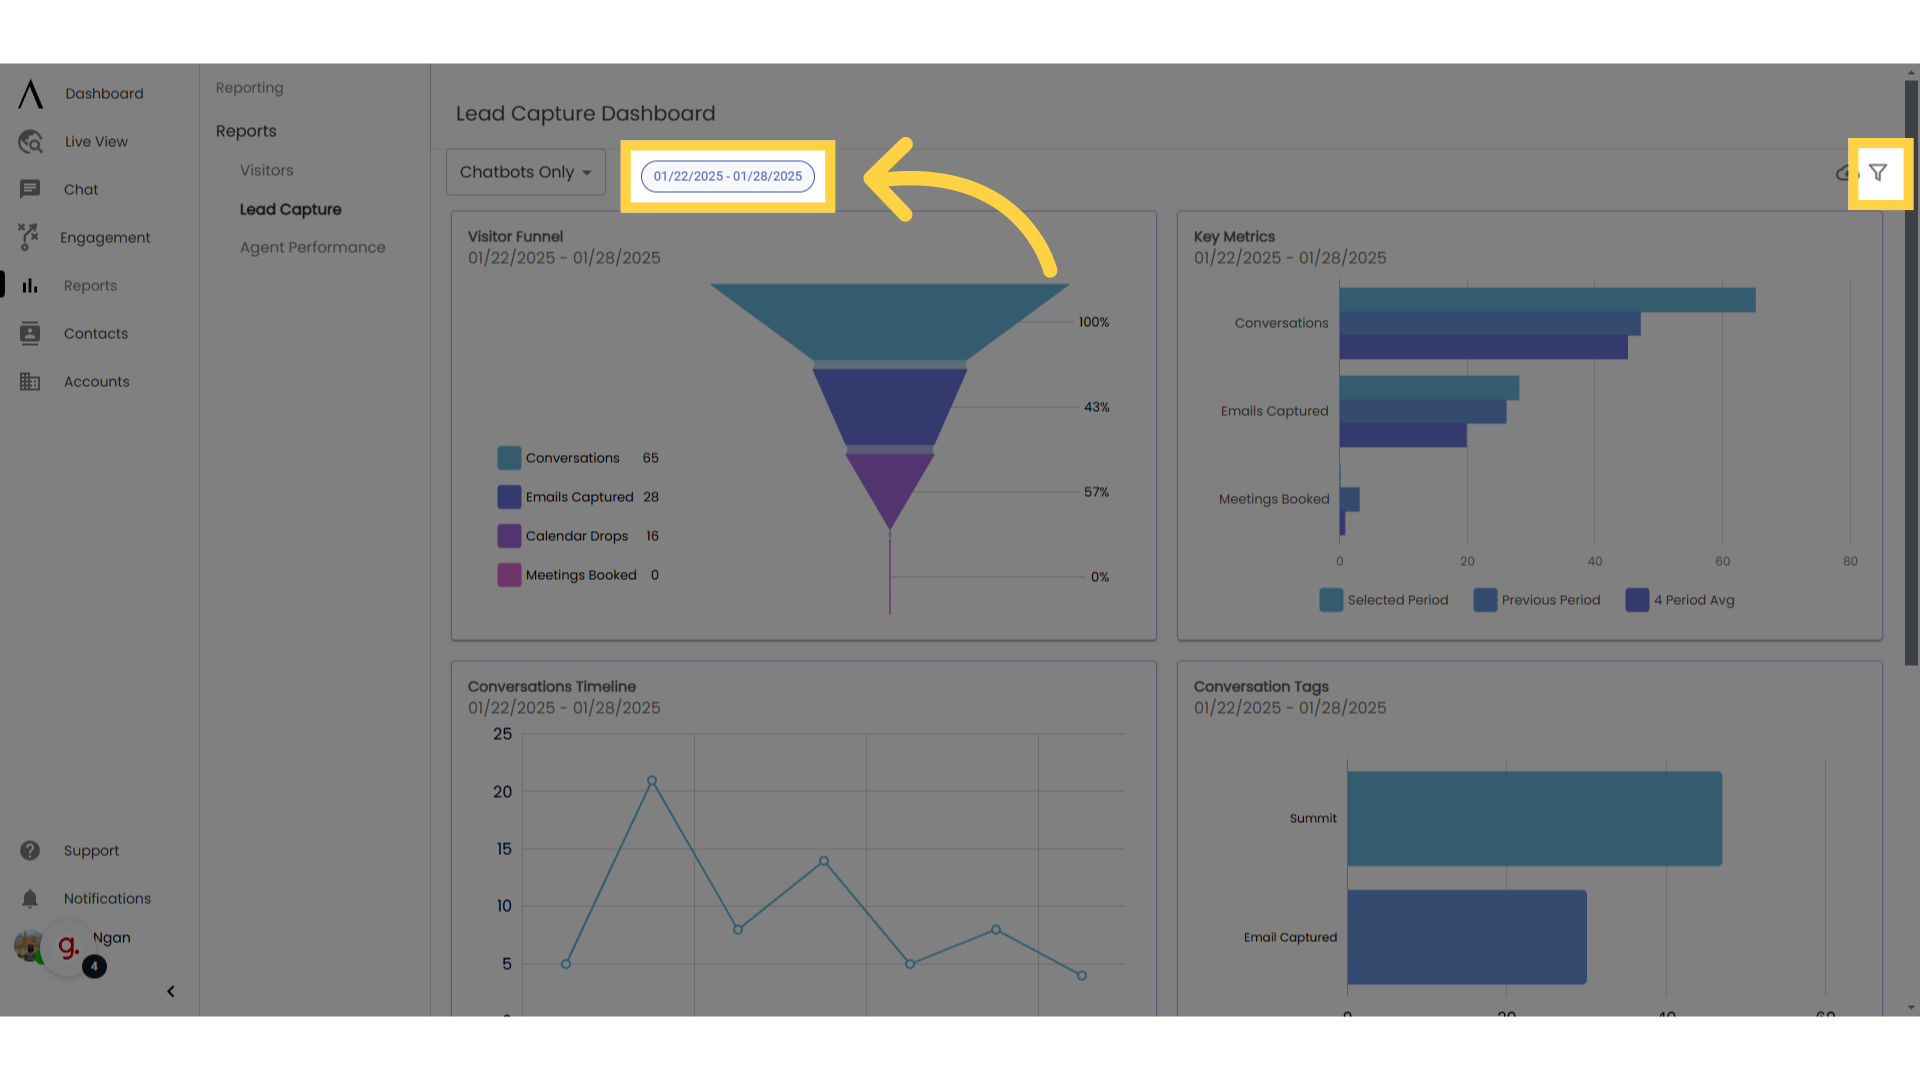
3. Select date range
Select the date range bubble at the top right corner of the dashboard. Pick a date range on the calendar, or pick one of the default ranges on the left.
You can also select a date range using the funnel icon on the upper-right corner of the page.
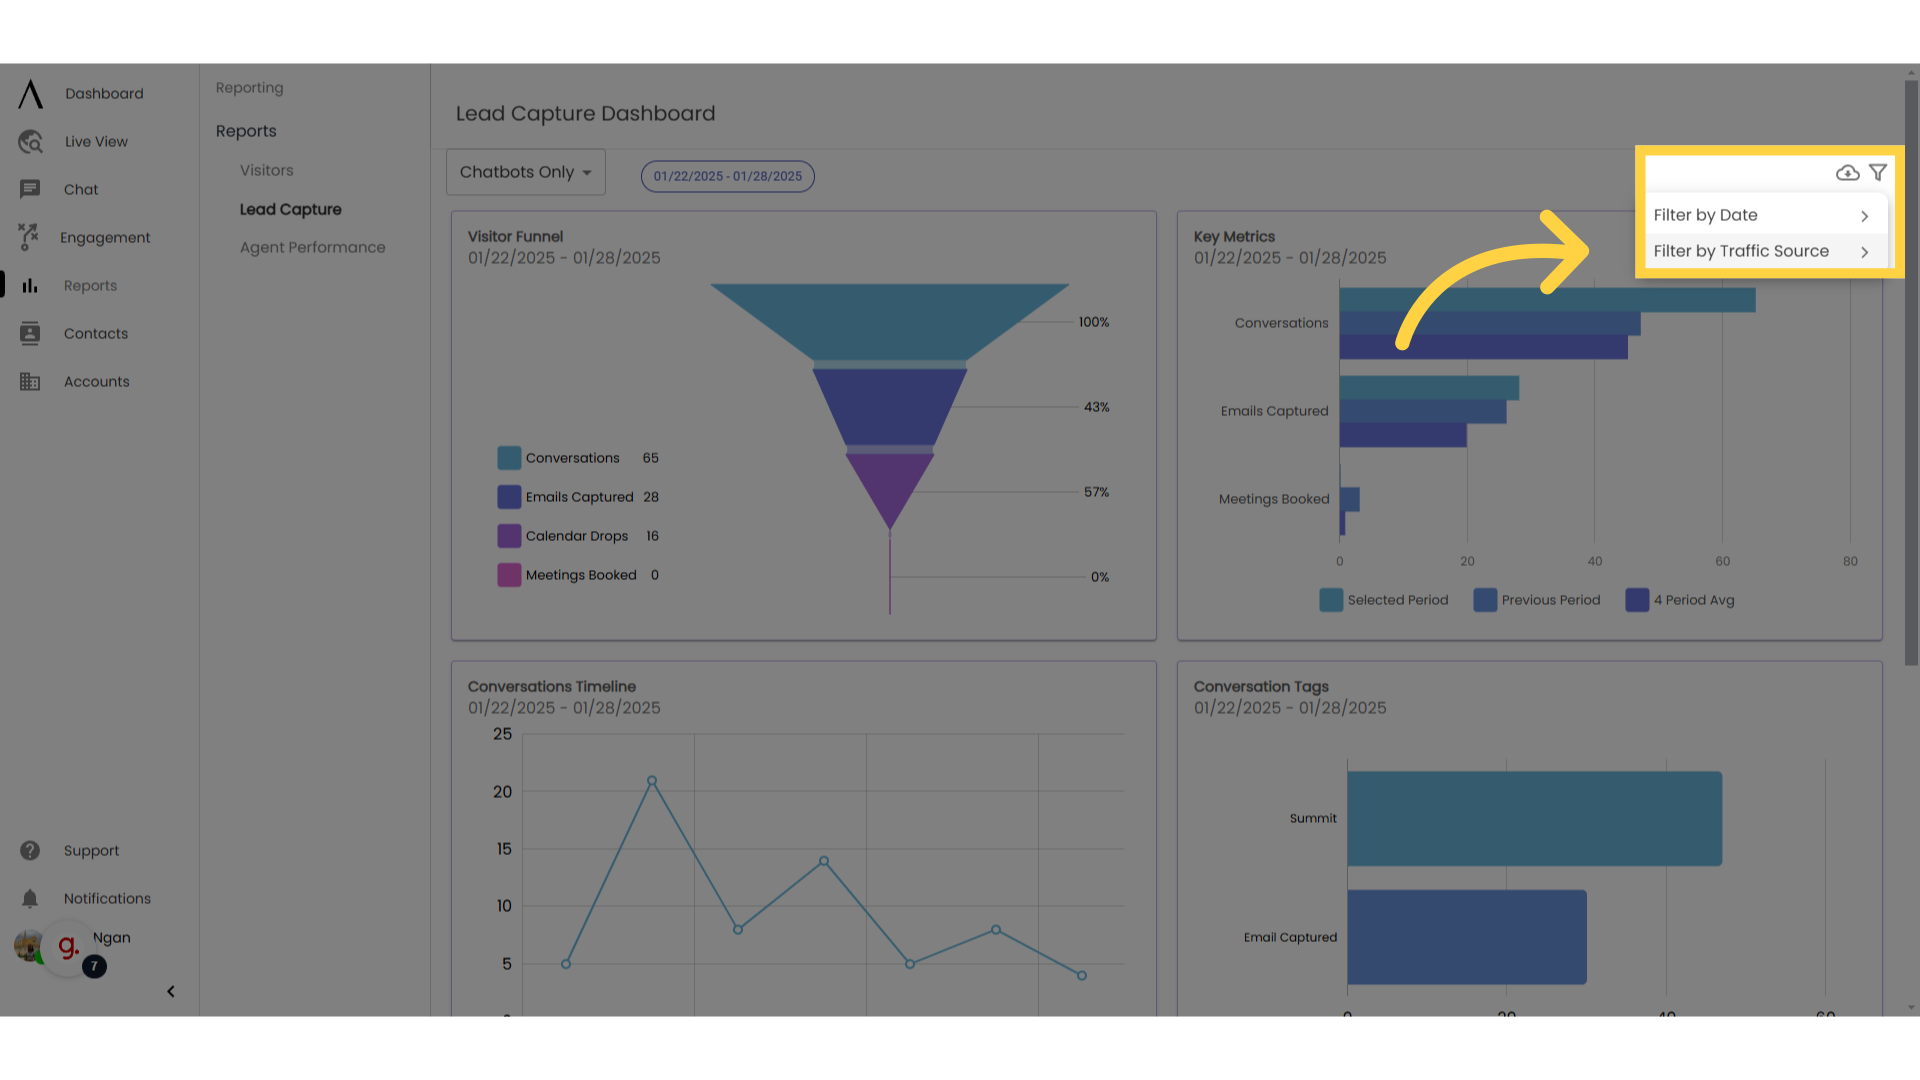
4. Filter by Traffic Source
The funnel button also allows you to filter by traffic source. Select those that you want to include, then click "Apply.

5. Filter by Traffic Source
The funnel button also allows you to filter by traffic source. Select those that you want to include, then click "Apply.
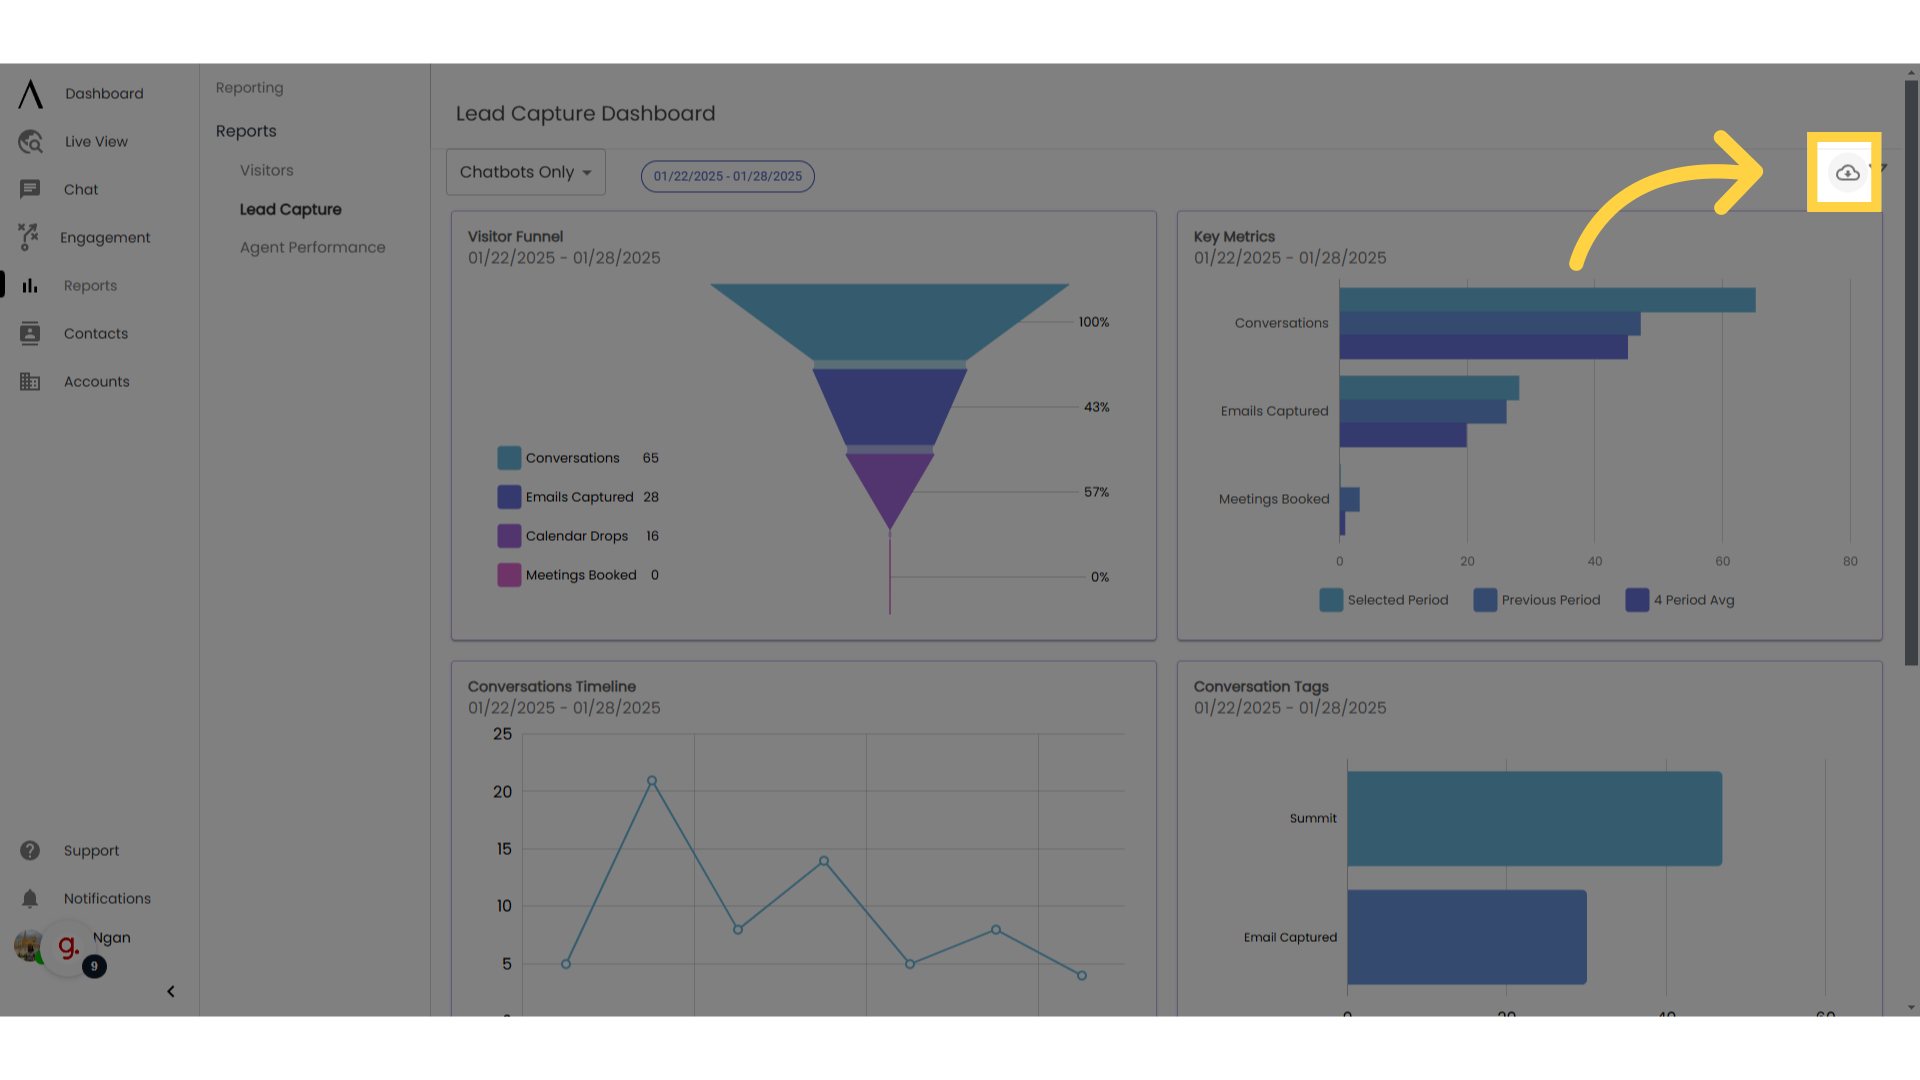
6. Export your CSV
Export all conversations as a CSV by clicking the export button at the top right, next to the filter button.
Note: All active filters will apply to the exported data, so be sure to double check your filters before exporting data. Opening this file in a spreadsheet application will present each conversation as a row of data with the columns being different variables.
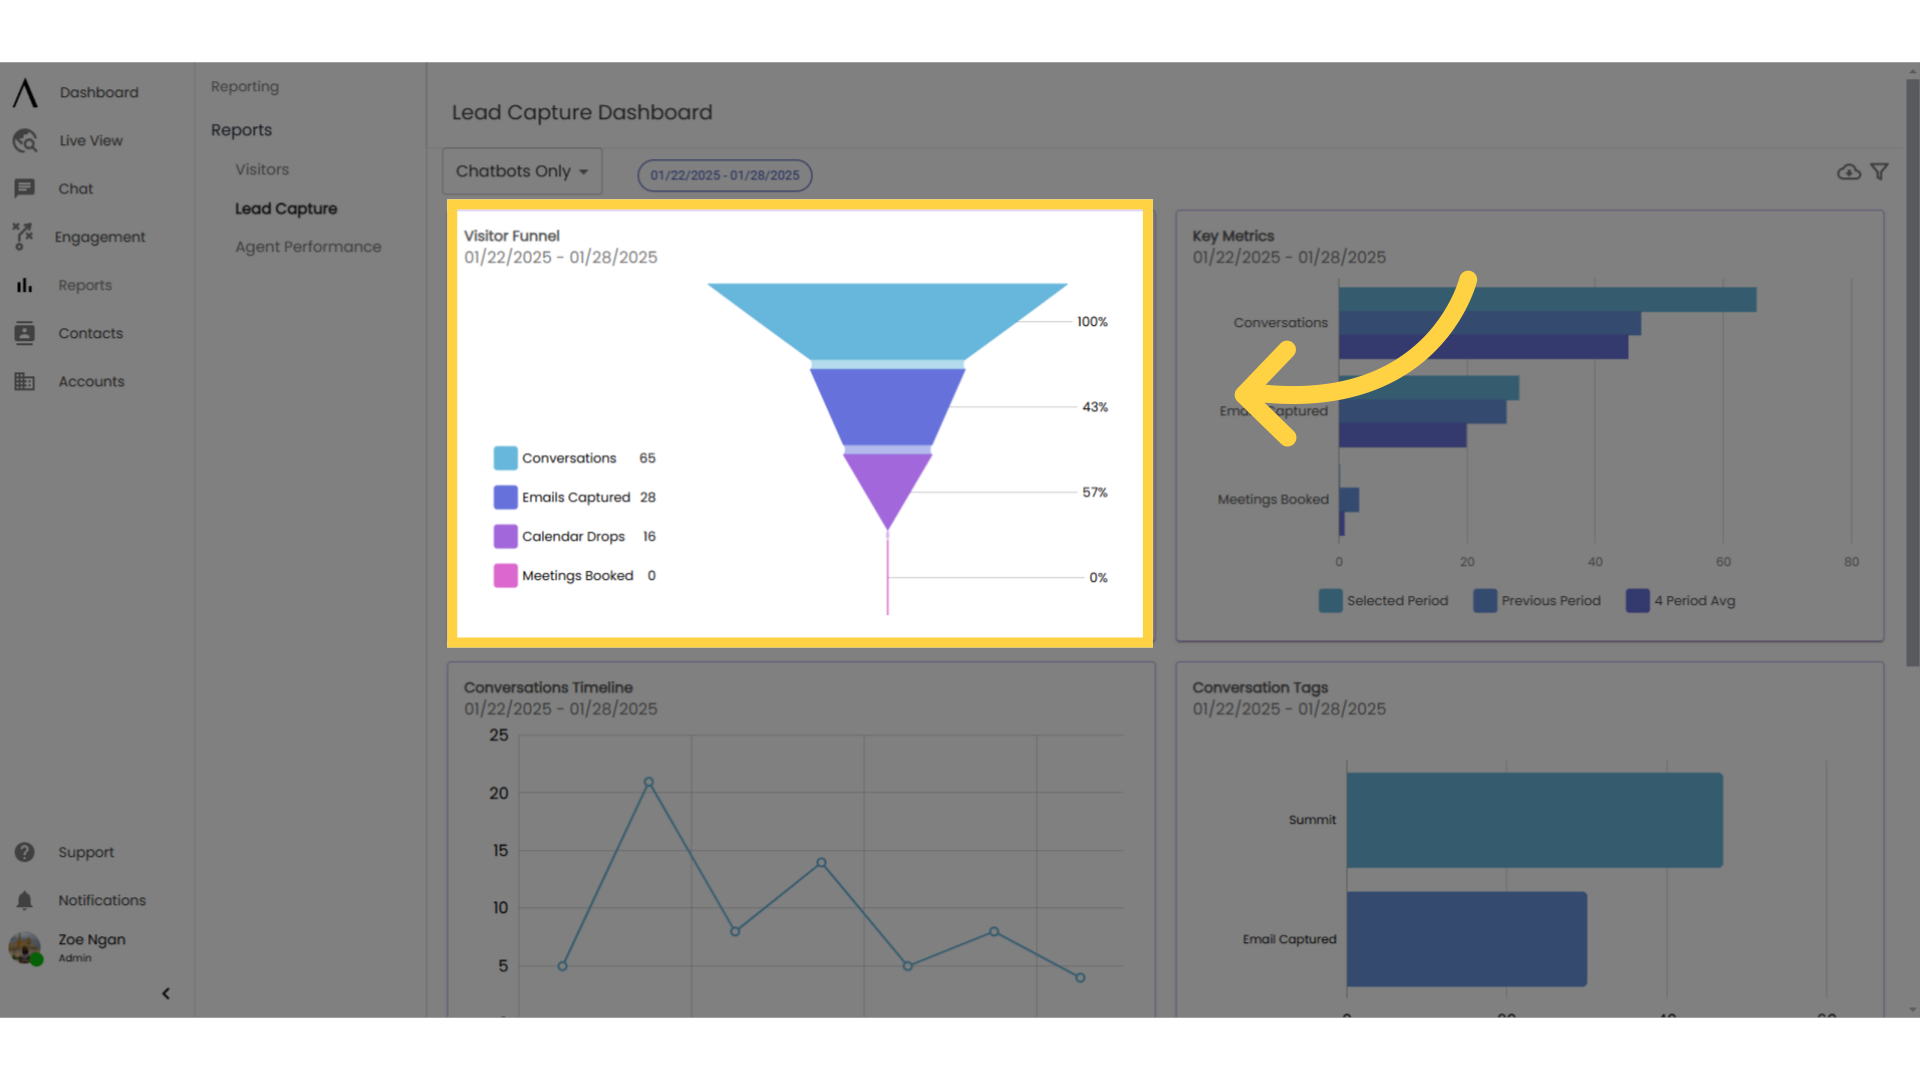
7. Visitor Funnel
The visitor funnel provides an overview of your chatbot performance. View total conversations, emails captured, calendar drops, and meetings booked for your selected date range, along with conversion rates down every step of the funnel. along with conversion rates down every step of the funnel.
Click on any metric in the graph legend to remove it from the visual report. Click again to add it back in. The same applies to Key Metrics.
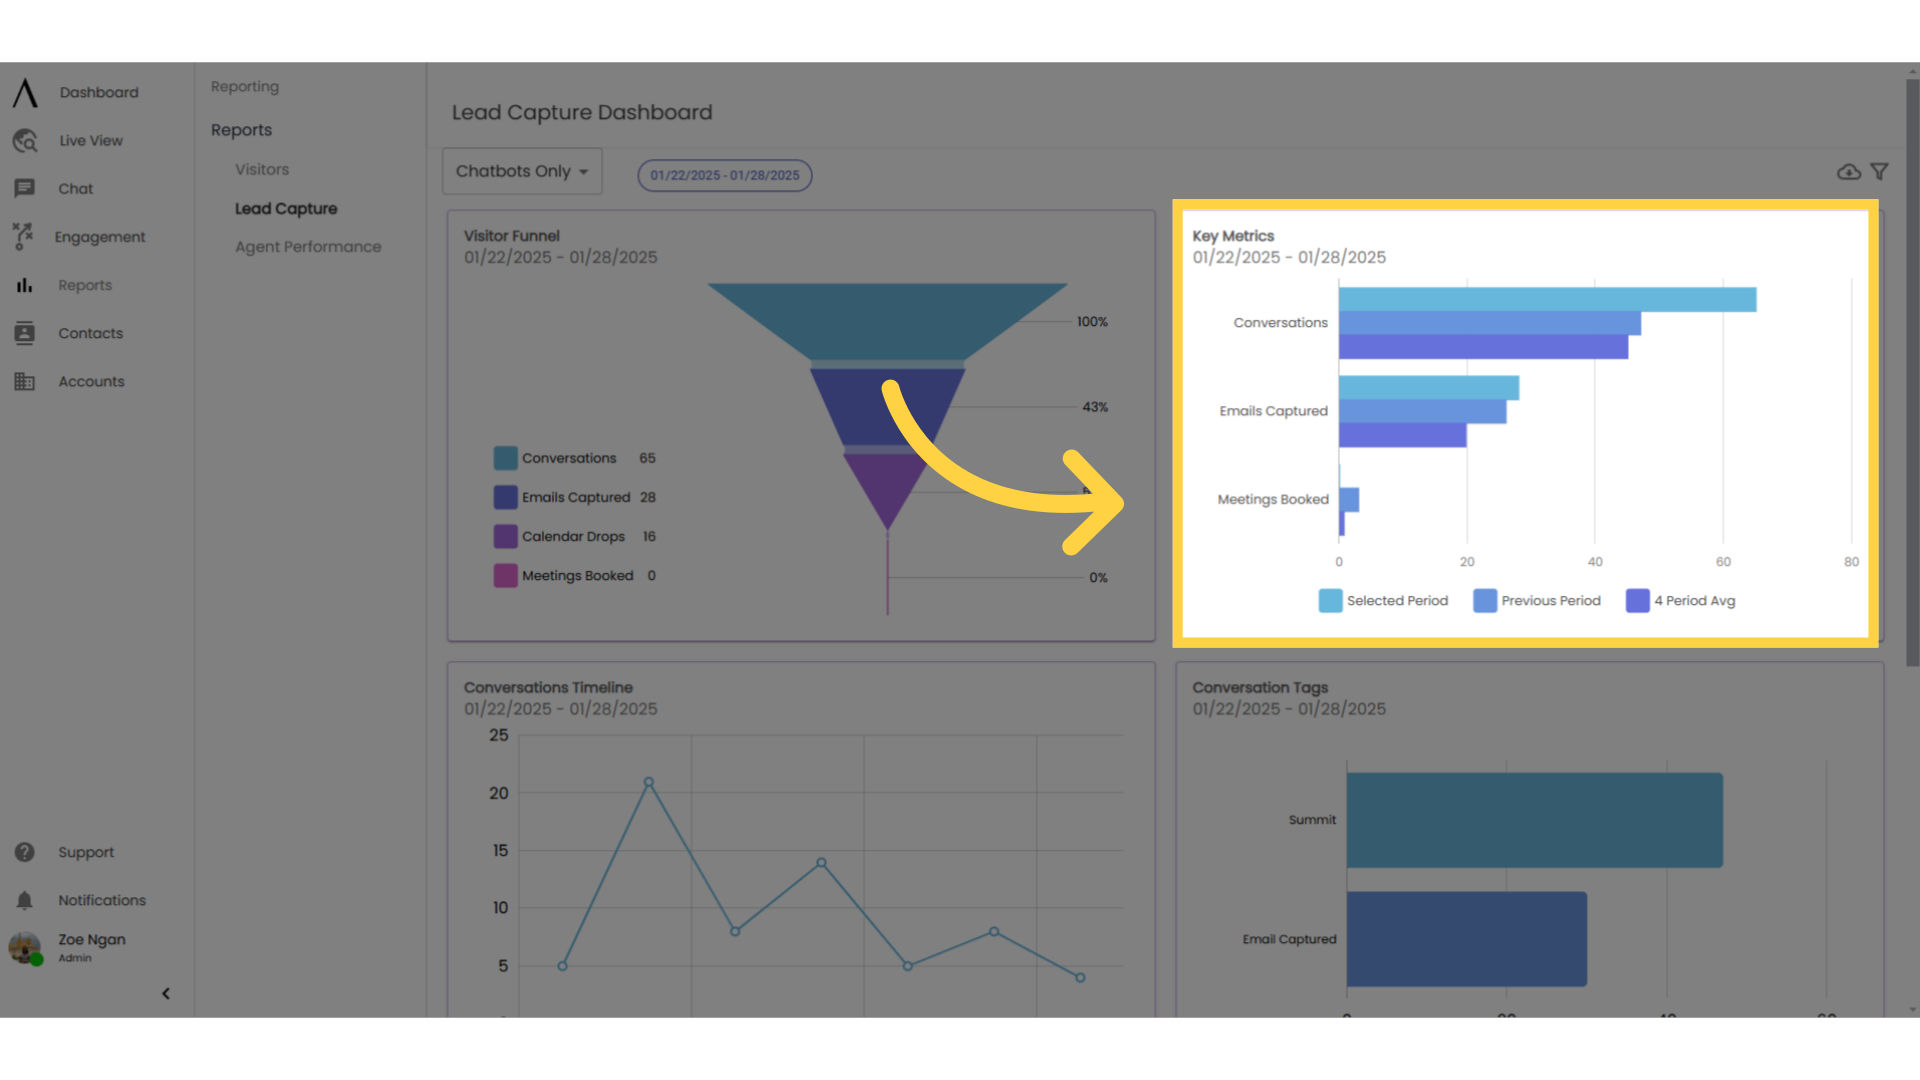
8. Key Metrics
Key Metrics in Signals are conversations, emails captured, and meetings booked. The Key Metrics widget provides insights into the way these metrics are changing over time.
Note: this widget only tracks emails captured and meetings booked by automation. The best way to track total emails captured and meetings booked with active live agent chat support is with tagging.
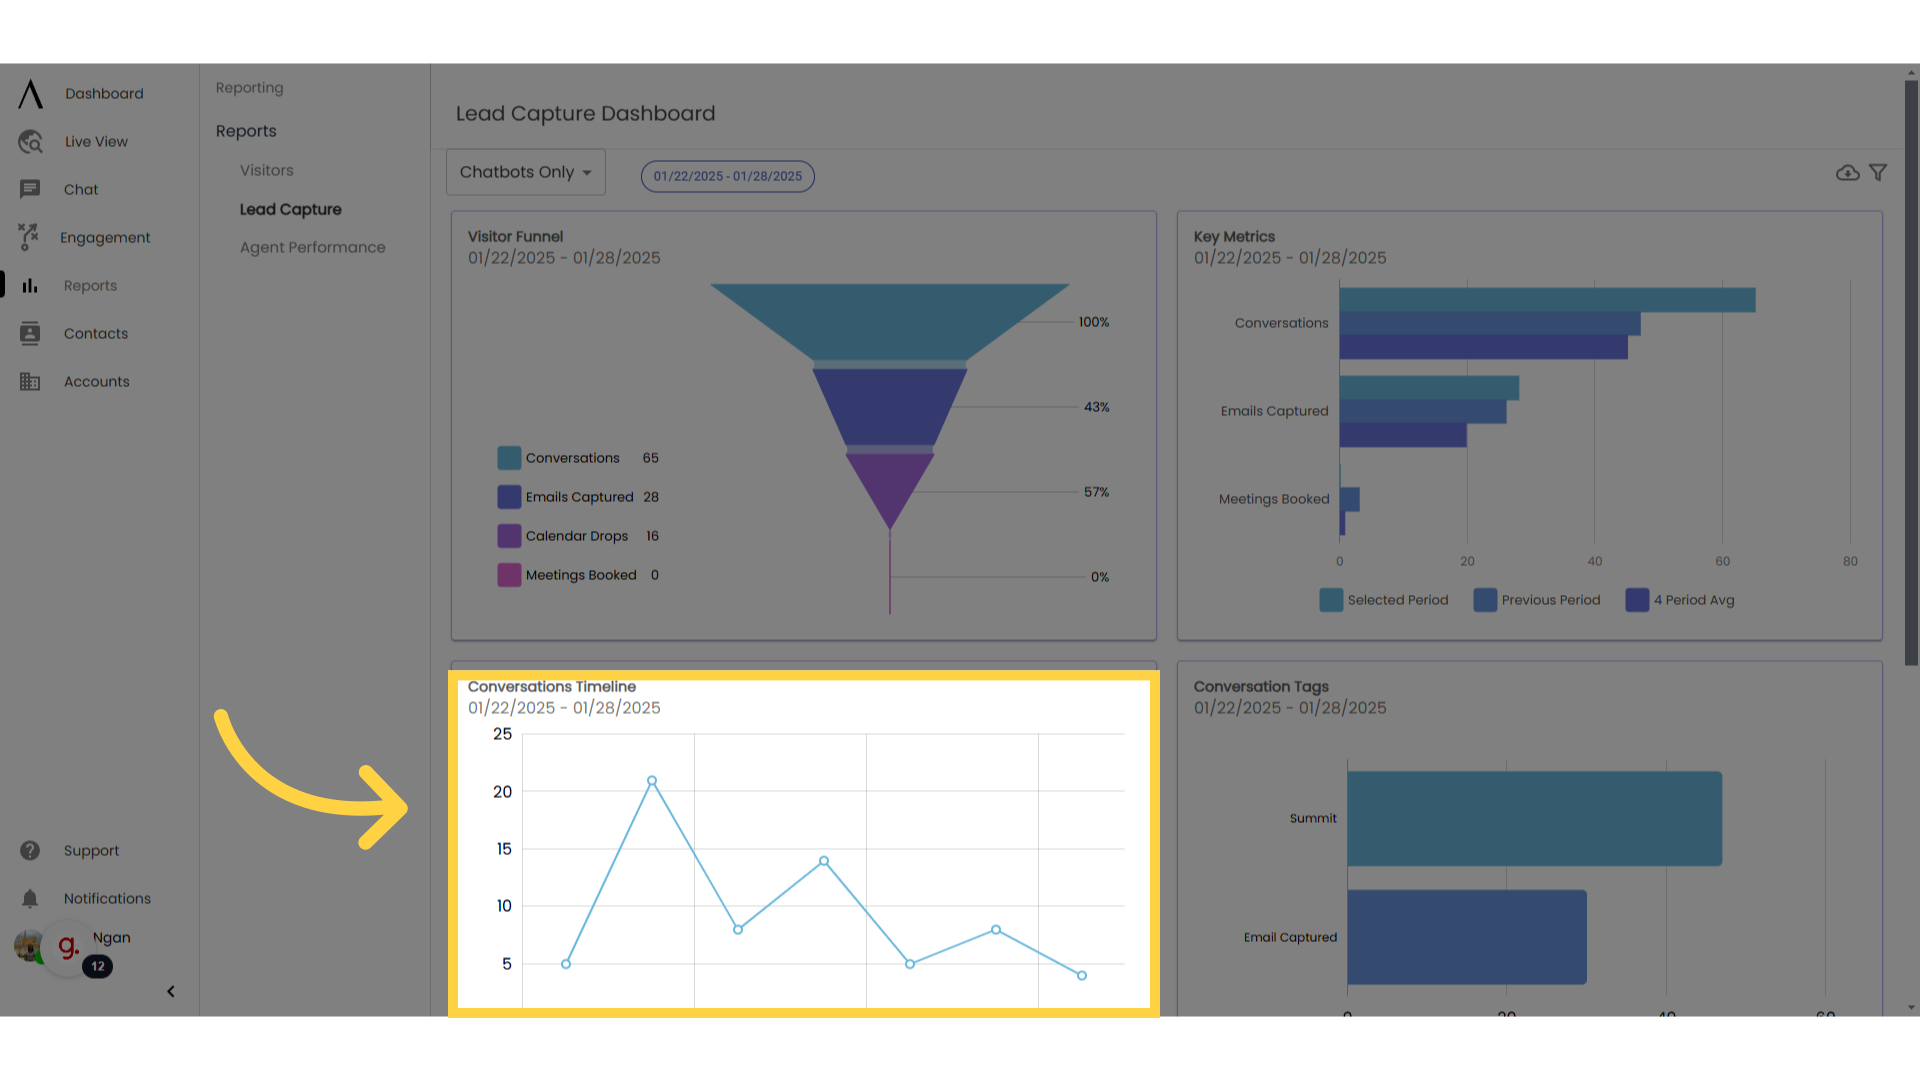
9. Conversations Timeline
The Conversations Timeline widget displays conversation count per day. Hover over any date on the widget for details about that day.
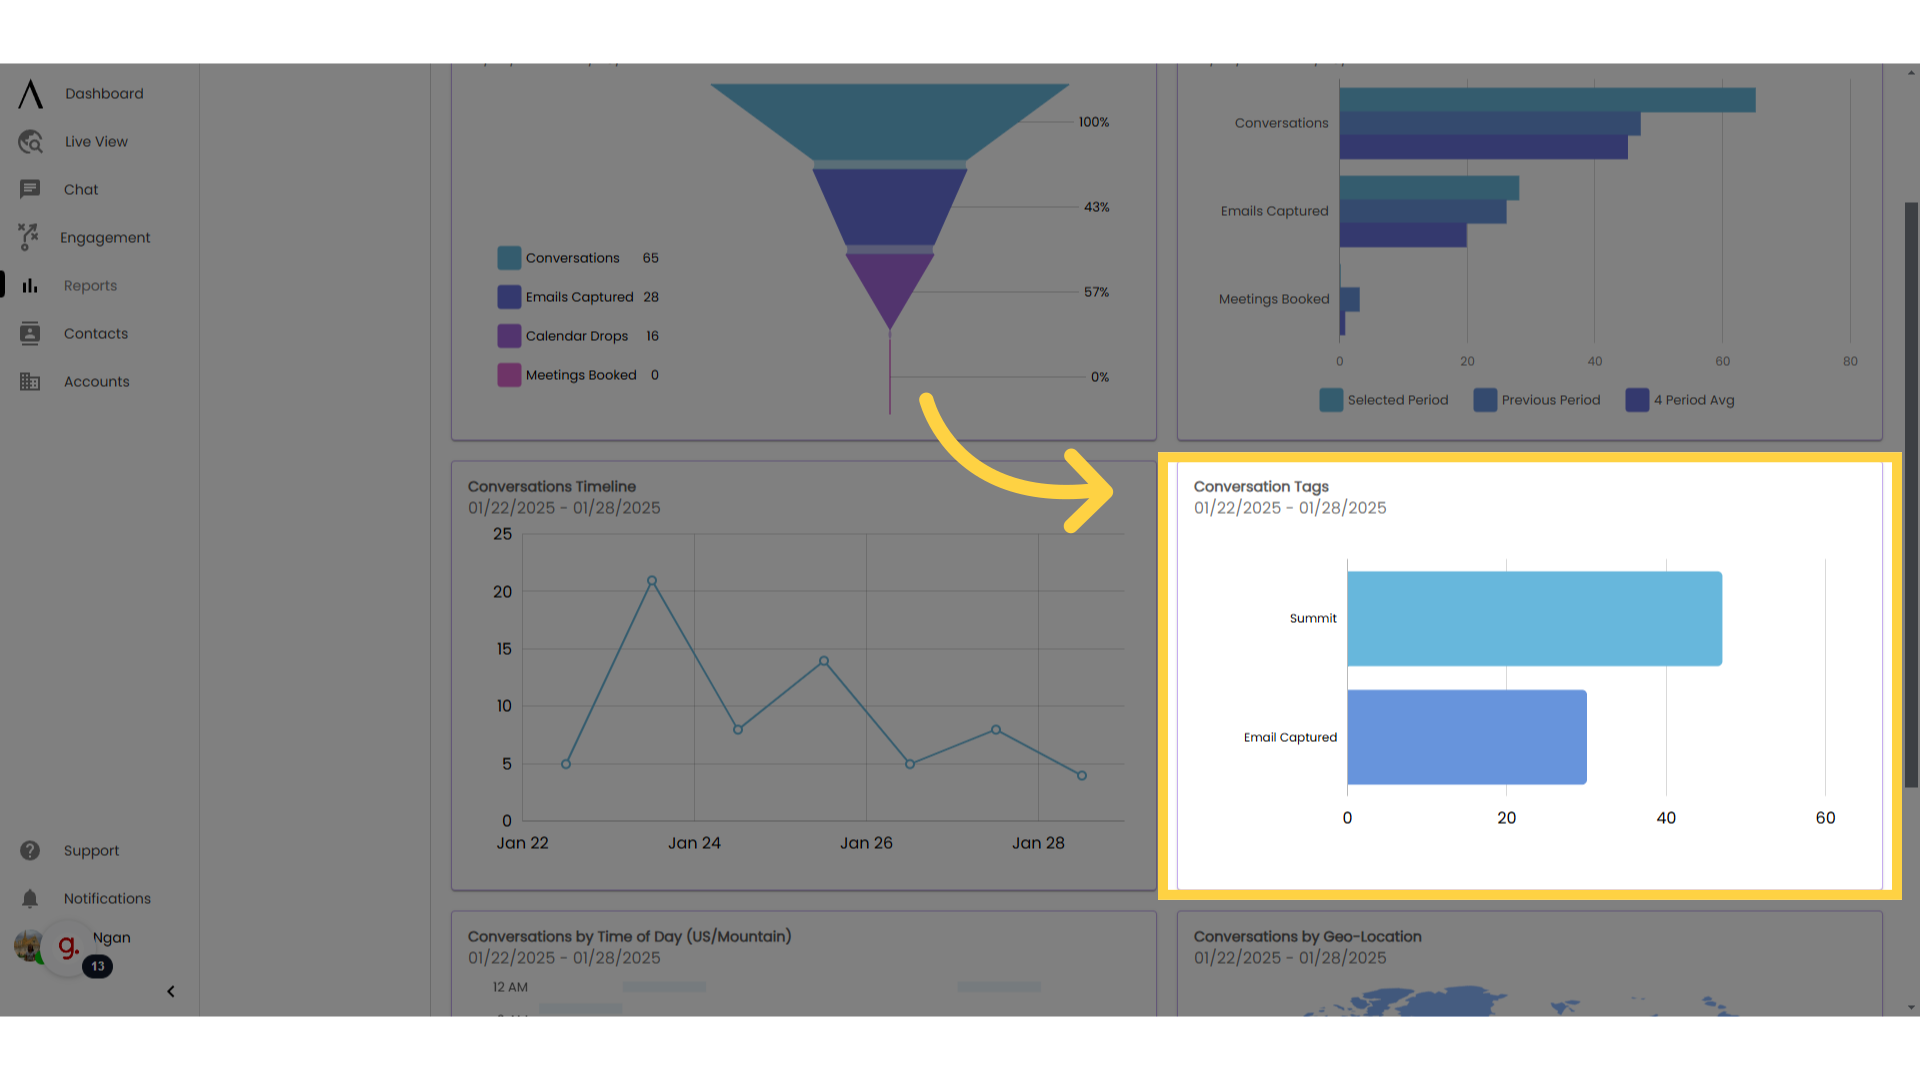
10. Conversation Tags"
The Conversation Tags widget shows you how many of each conversation tag has been applied during the specified date range.
Note: Only the top eight most common conversation tags for your organisation will display in the widget. If you're tracking more than eight tags, export the conversation report and filter the "Conversation Tags" column to view totals for additional tags.
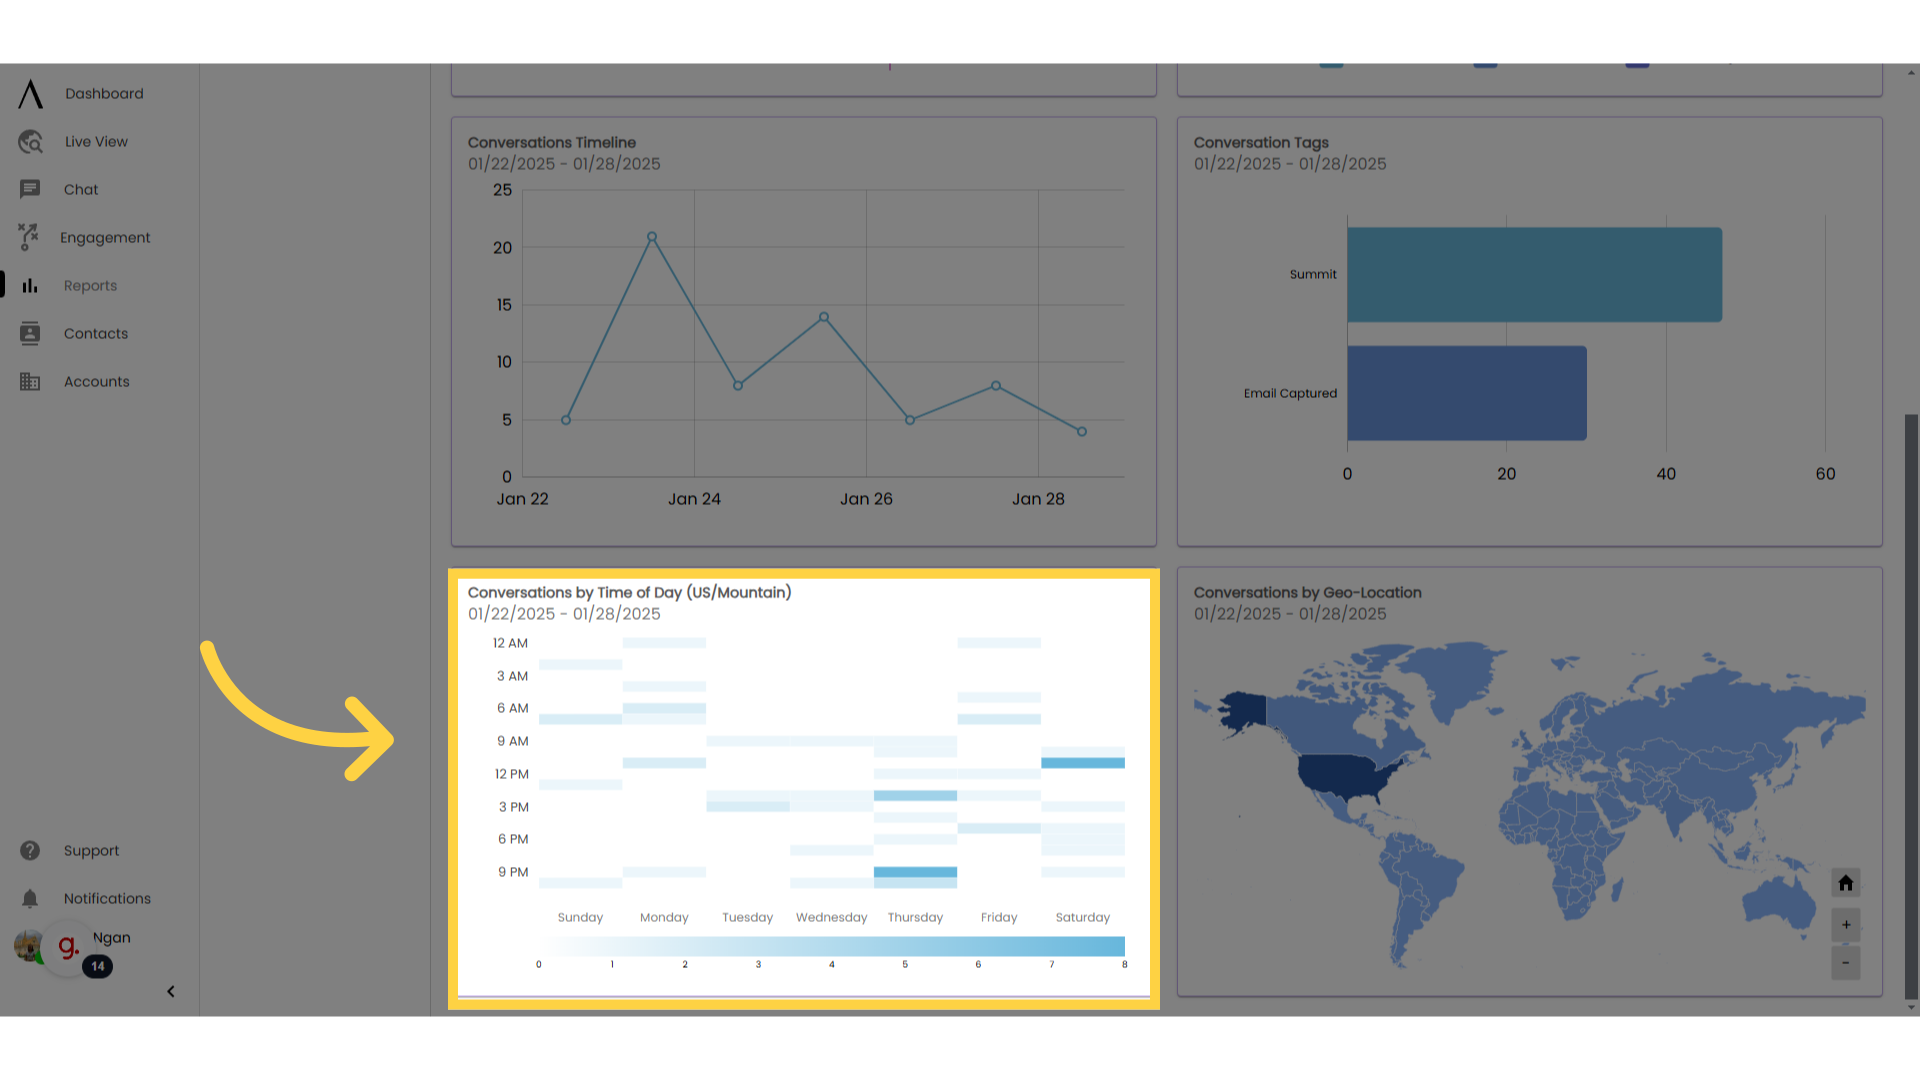
11. Conversations by Time of Day
The Conversations by Time of Day widget displays how many conversations your organisation had in the specified time period, broken out by days of the week and hours of the day. This can help you see what hours of the day are most busy to assist you with staffing decisions.
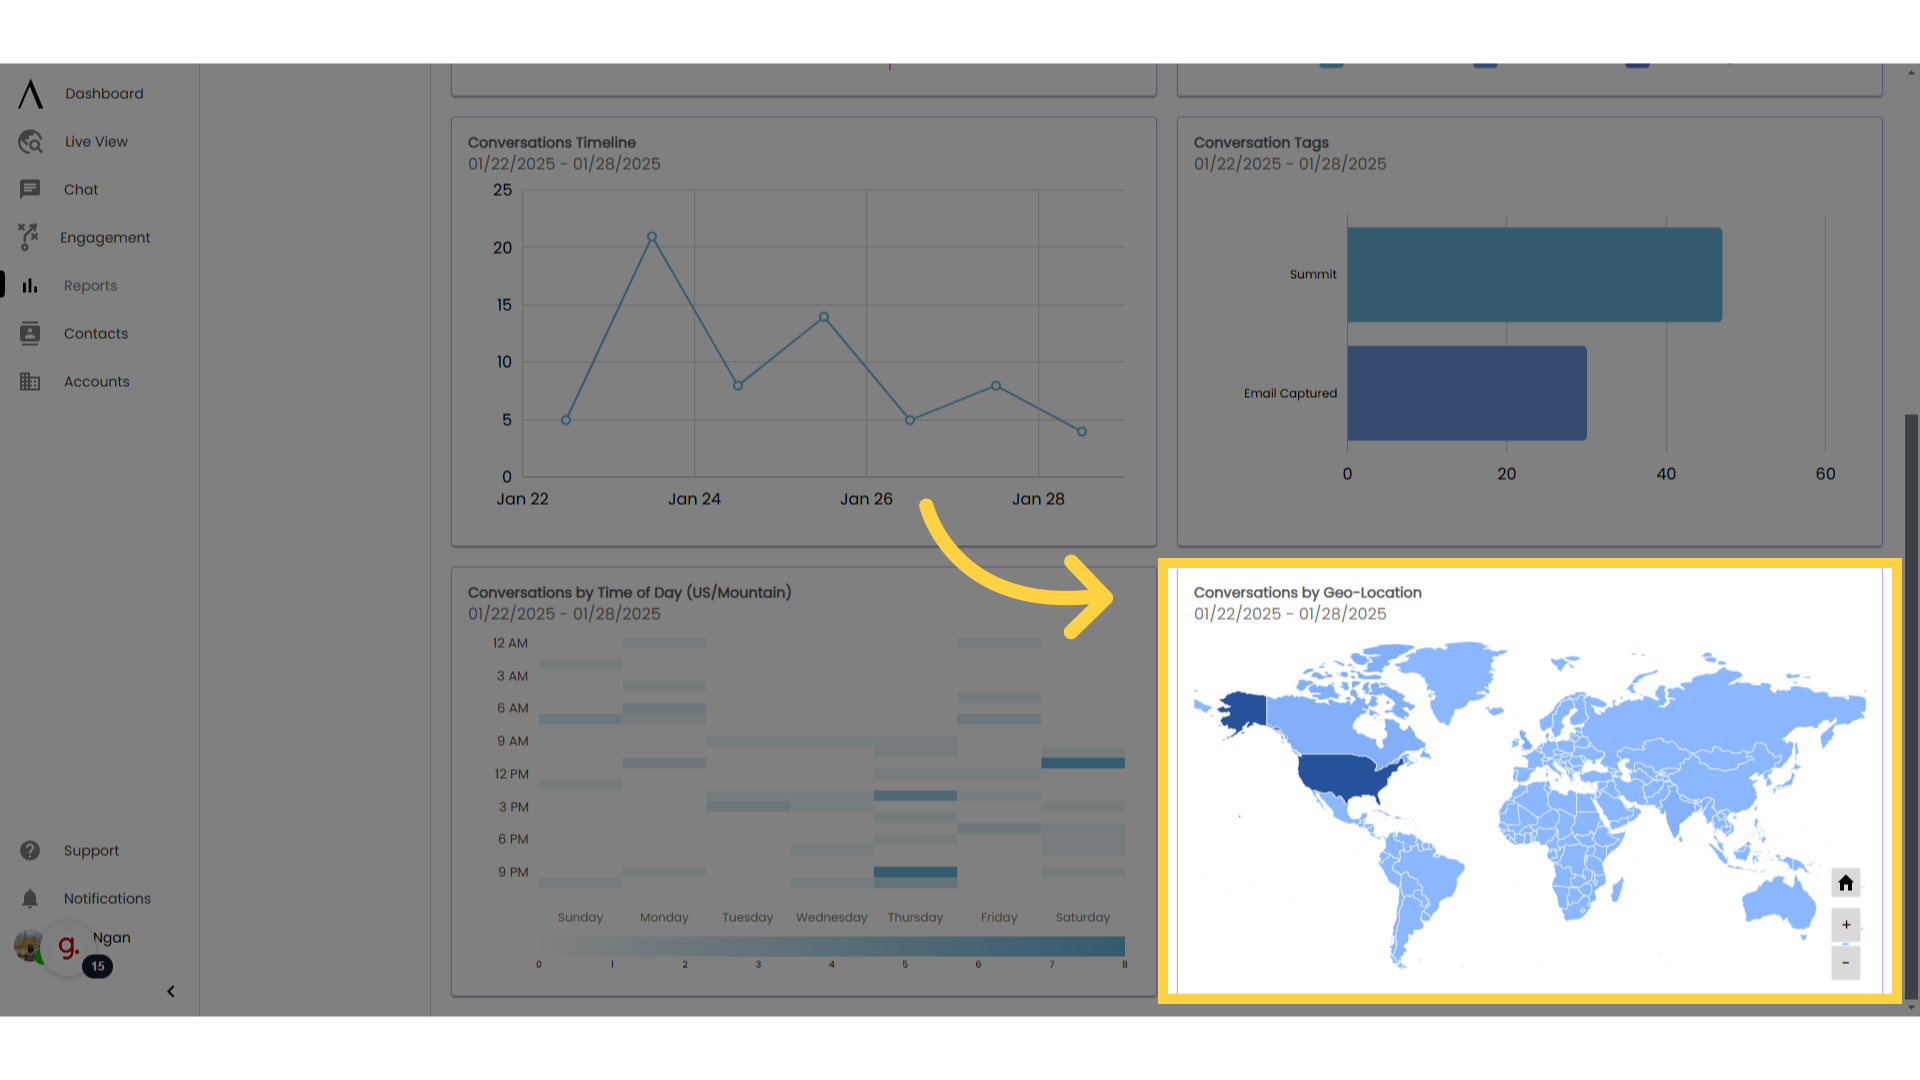
12. Conversations by Geo-Location
The default view of this widget shows a world map split out by countries, but you can add granularity by clicking on the country of interest.