Visitor Dashboard
Visitor Dashboard
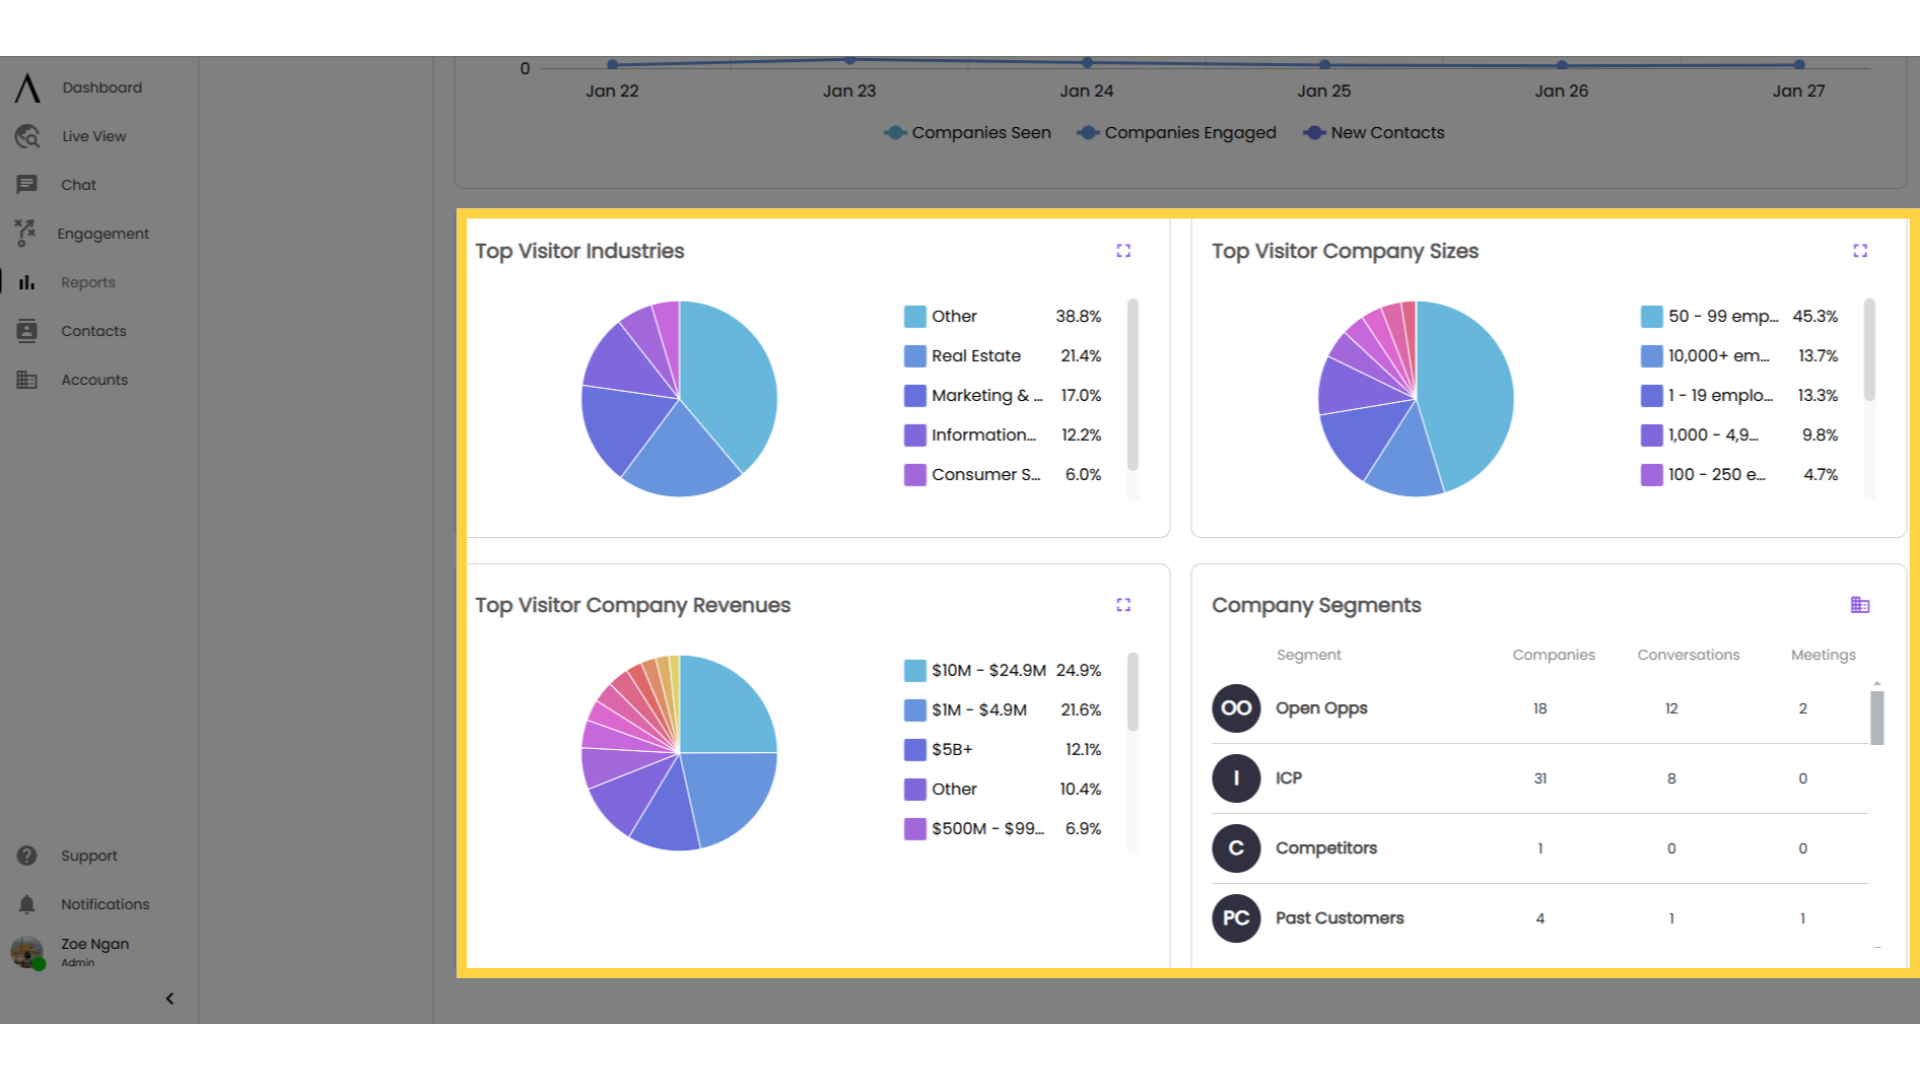
The conversation reporting dashboard features 5 preset reporting widgets and a filter option.
Go to app.getsignals.ai
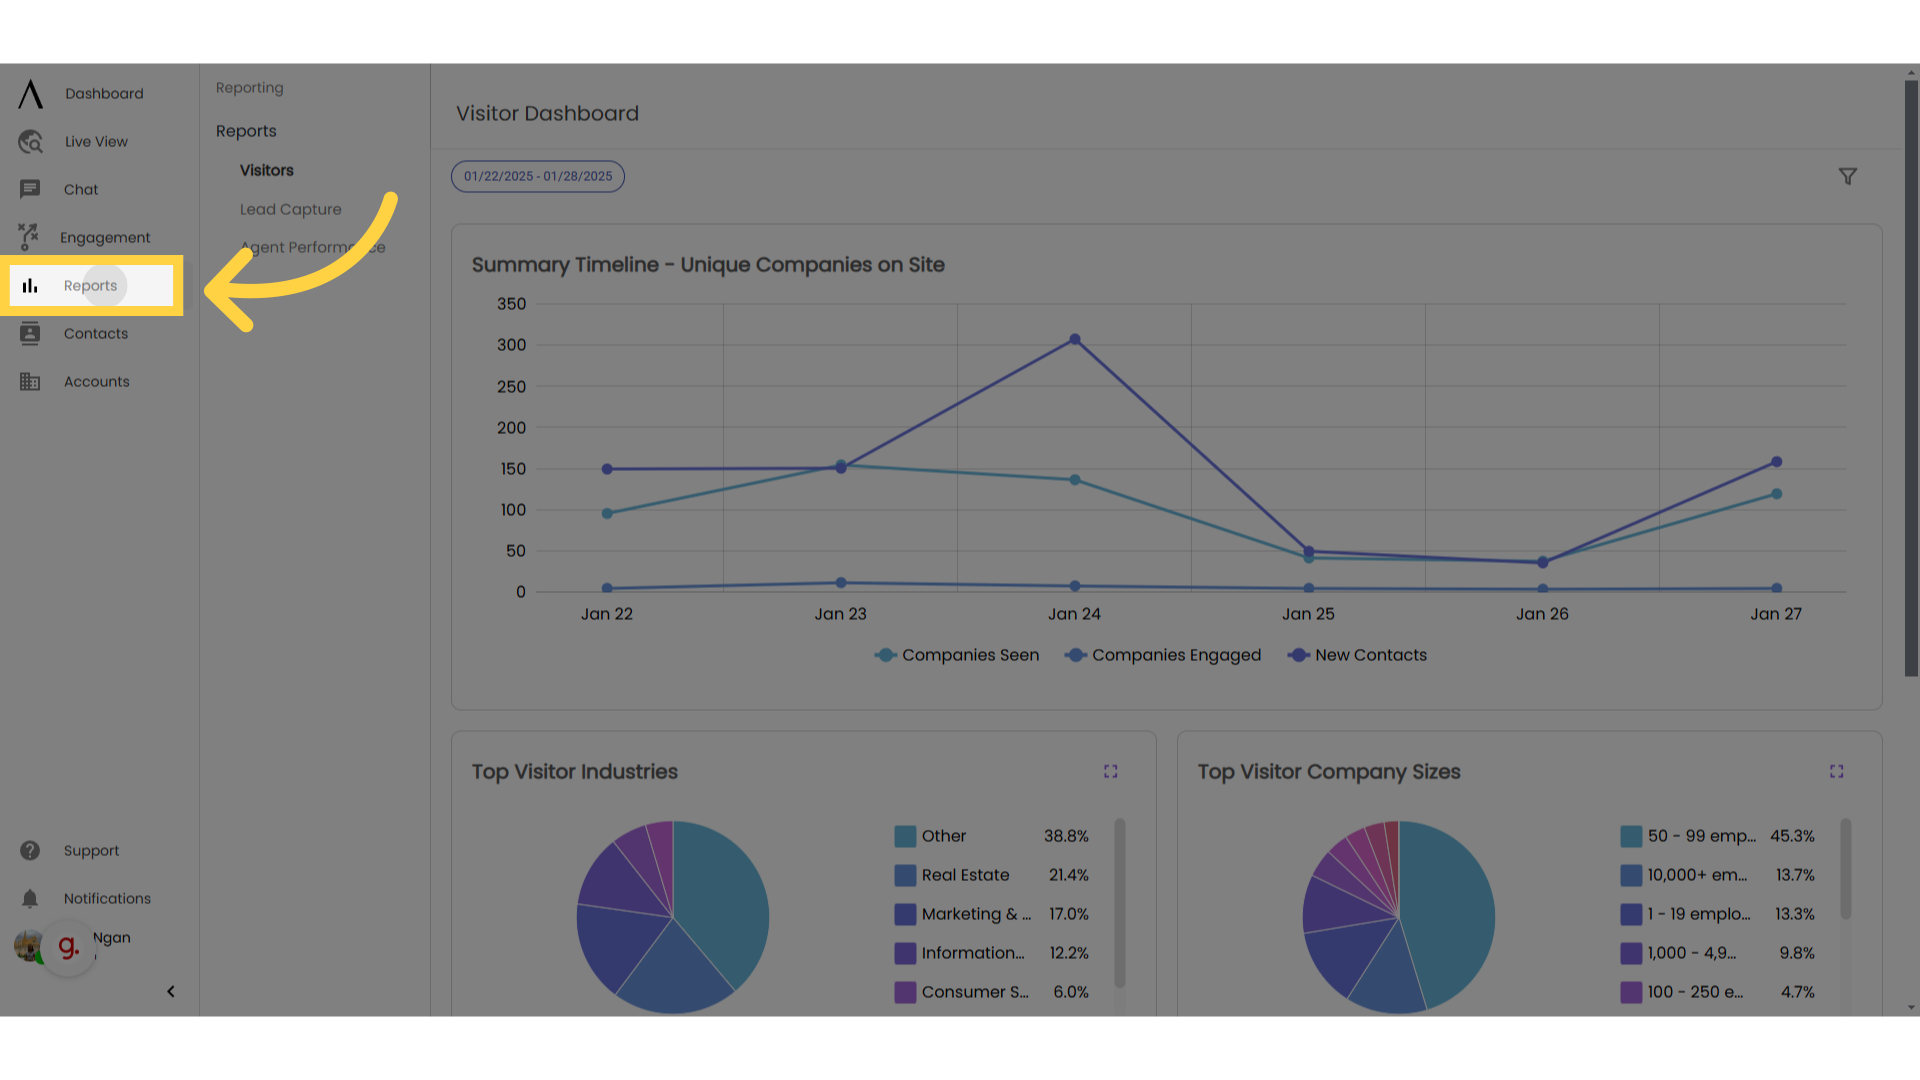
1. Click "Reports"
First, click on Reports in the left sidebar. The visitors' dashboard will be the default report that comes up.
2. Filter by date range
Filter the report by date range at the top of the page. You can also change date range with the funnel button in the upper-right corner of the page. Click "Apply filter."
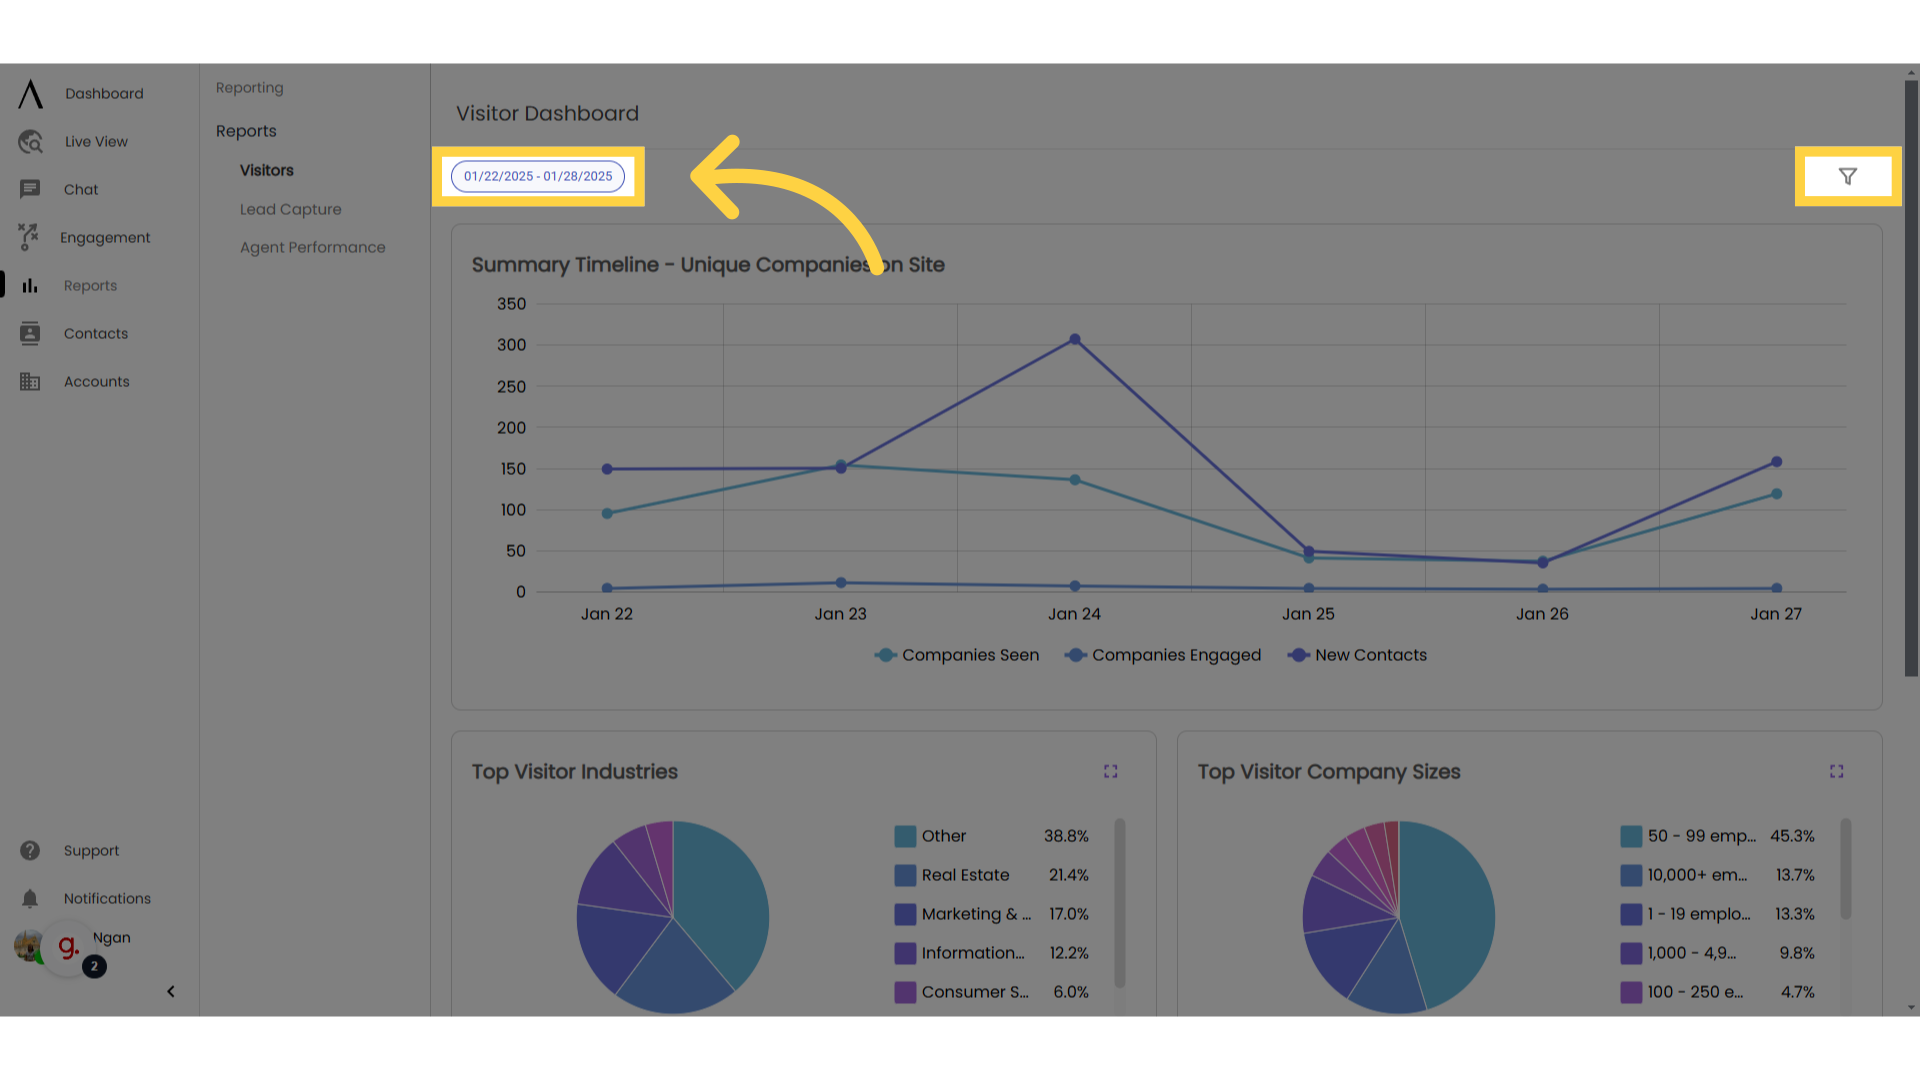
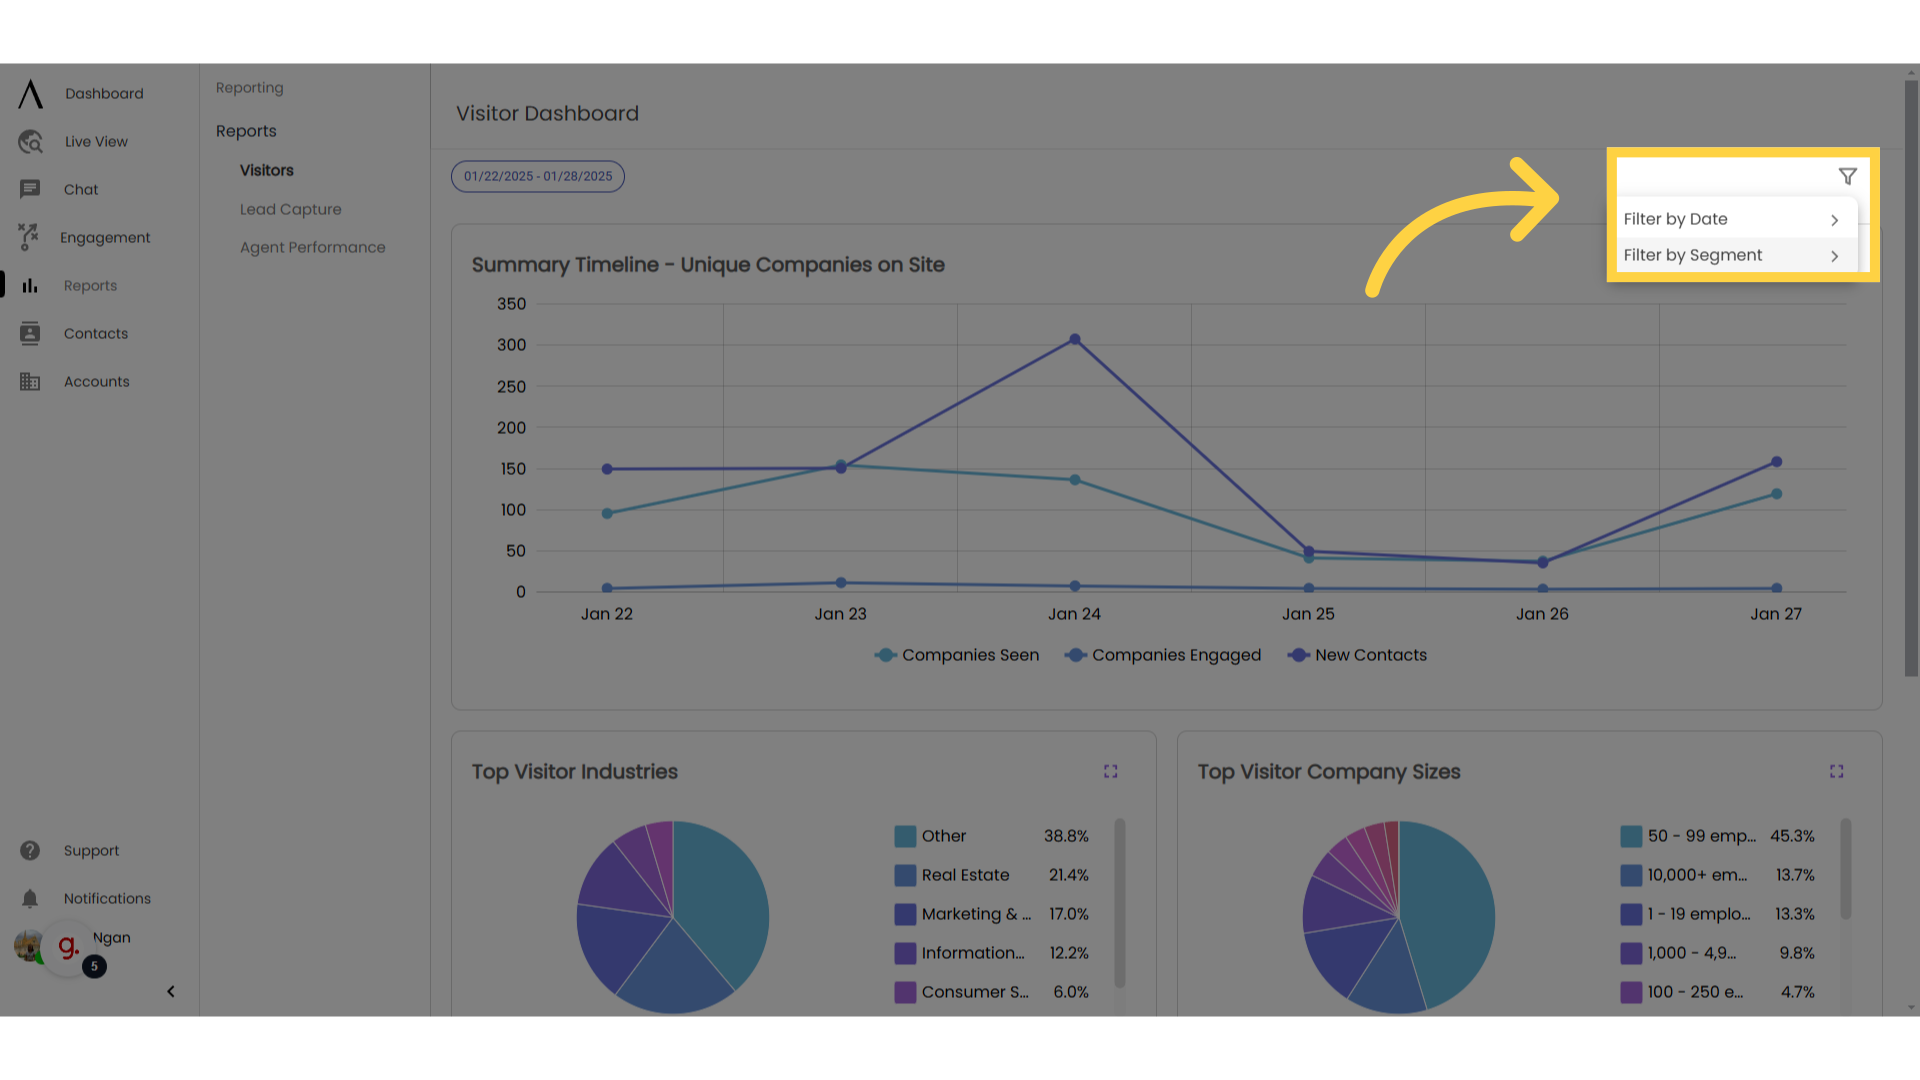
3. Filter by Segment if needed
The funnel button also has an option to filter by segment. Use as needed.
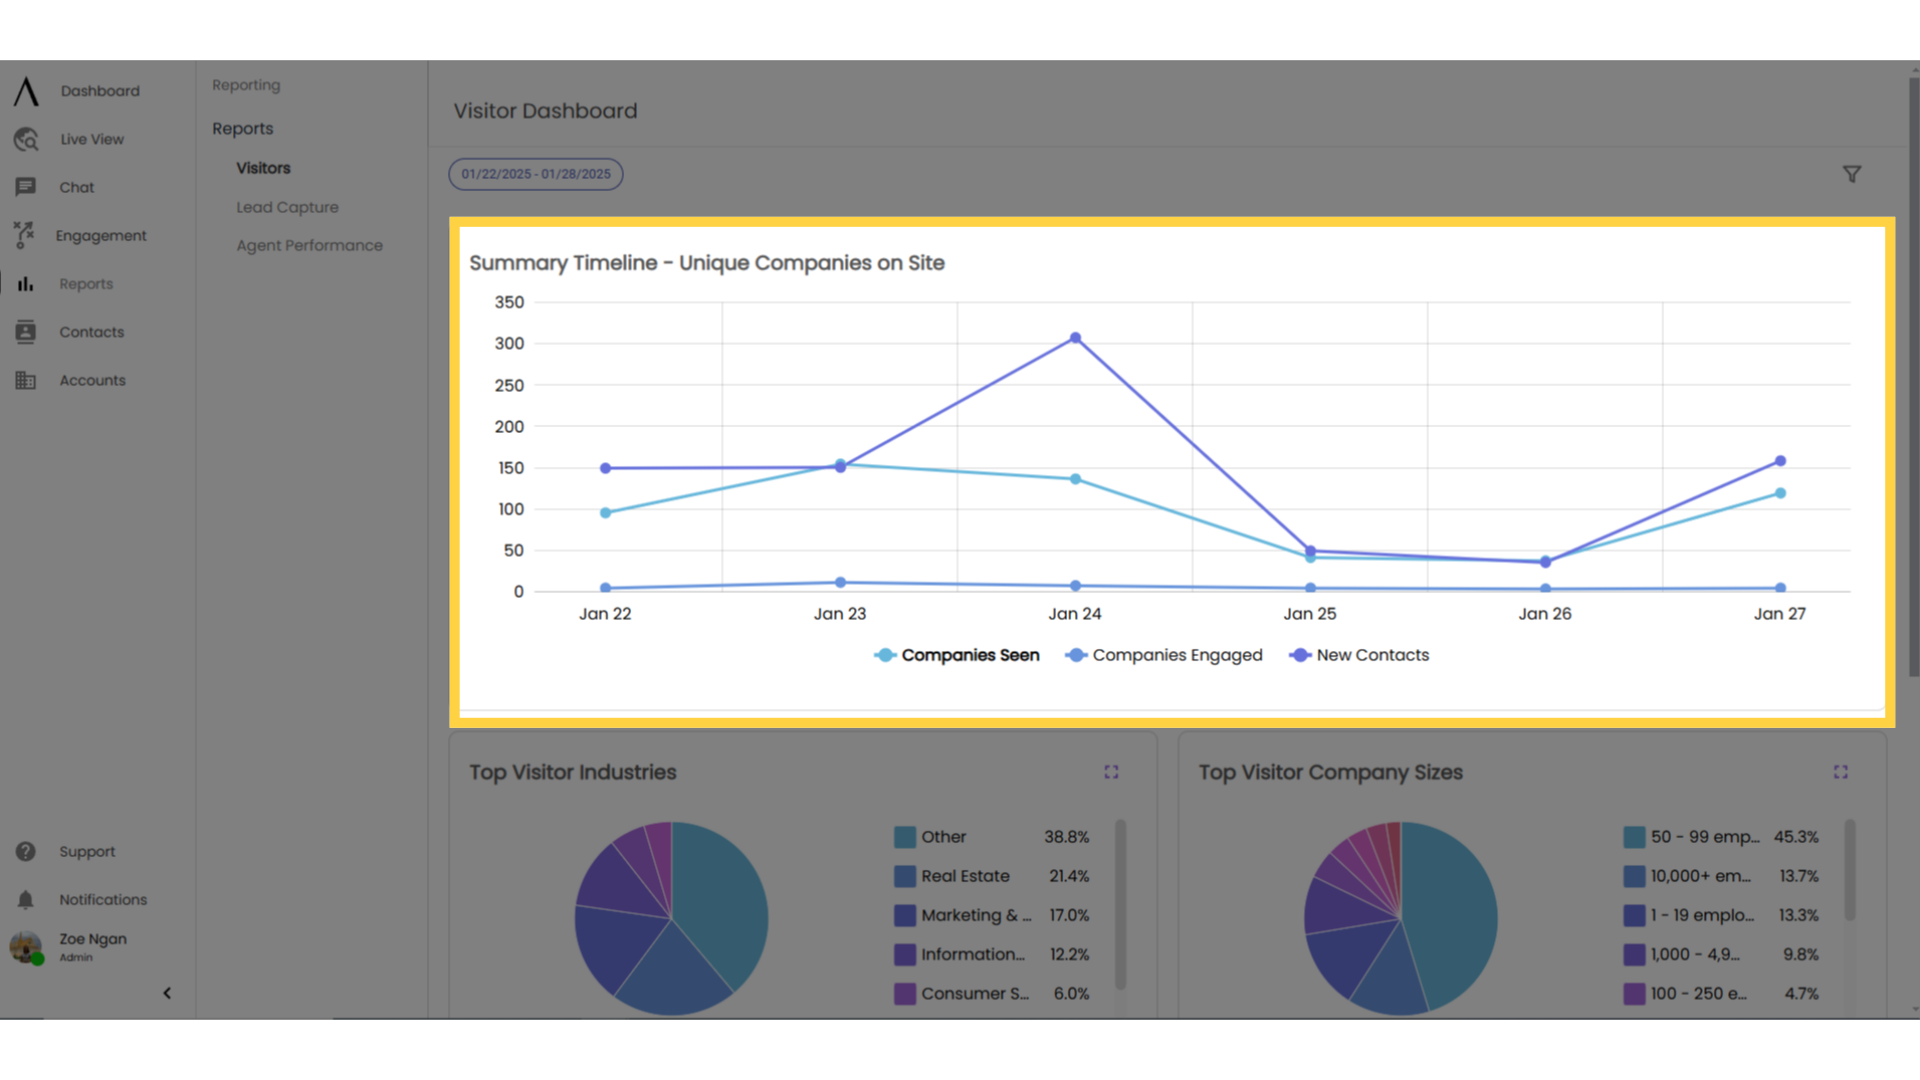
4. Summary Timeline
The summary timeline graph presents the number of companies that have been on your site, engaged with the site, and any new contacts.
5. Visitor Reports
These reports show additional information about your visitors, such as company revenues. Hover over the pie-chart for more detail.